I feel a connection to the Brahmaputra River. In 1995, my husband and I visited Assam and even took a rafting trip on one of the Brahmputra's tributaries. In 1998, I had the privilege of going to Tibet, where I traveled along the Yarlung Tsangpo River, as the river is known in its upper reaches. Water issues concerning the river basin have since been of interest to me.
As I wrote in a previous post, Brahma Chellaney dedicated a whole chapter on the Tibetan Plateau in his book Water: Asia's New Battleground. He also discussed China's unwillingness to participate in transnational water commissions or international agreements. It should come as no surprise then that China turns down India's proposal for joint mechanism on Brahmaputra.
The Ganges Brahmaputra River Basin area was created from the data set Hydrological basins in Southeast Asia.
The majority of the linework of the map was obtained by delineating drainage basin boundaries from hydrologically corrected elevation data with a resolution of 15 arc-seconds. The elevation dataset was part of a mapping product, HydroSHEDS, developed by the Conservation Science Program of World Wildlife Fund. Original input data had been obtained during NASA's Shuttle Radar Topography Mission (SRTM). Areas north of the SRTM extent, 60 degrees N, were obtained by merging with the HYDRO1k basin layer.
You may download a JPEG, PDF, or ArcMap document of the Ganges Brahmaputra River Basin.
Showing posts with label JPEG. Show all posts
Showing posts with label JPEG. Show all posts
Thursday, April 18, 2013
Tuesday, April 09, 2013
Map of projected population in #India 2015
Here is a map that I created that shows projected population in India in 2015. The data comes from the Population Count Grid, Future Estimates of the Gridded Population of the World, Version 3 (GPWv3). Future Estimates consists of estimates of human population for the years 2005, 2010, and 2015 by 2.5 arc-minute grid cells and associated data sets dated circa 2000. For more information, view the metadata.
As with my other maps, I created this map using Esri ArcMap 10. Each 2.5-min cell contains a value of the estimated population for that area in 2015. I have overlayed the population layer on top of the Ganges-Brahmaputra River Basin layer.
Unfortunately, I was not able to create a legend for this map. I have shared an ArcMap document (.mxd), a PDF file, and JPEG image via Google Drive. By selecting the population layer in the .mxd file and using the identification arrow, you can find out the population for that 2.5-min cell..
Citation:
Center for International Earth Science Information Network (CIESIN)/Columbia University, United Nations Food and Agriculture Programme (FAO), and Centro Internacional de Agricultura Tropical (CIAT). 2005. Gridded Population of the World, Version 3 (GPWv3): Population Count Grid, Future Estimates. Palisades, NY: NASA Socioeconomic Data and Applications Center (SEDAC). http://sedac.ciesin.columbia.edu/data/set/gpw-v3-population-count-future-estimates. Accessed 09 April 2013.
Tuesday, February 26, 2013
Map of West Bengal #India
If you've noticed, I added a TripIt badge to the sidebar, which shows that I'm going to Kolkata (Calcutta) on Thursday. This inspired me to create a map of West Bengal, complete with inset map showing the location of West Bengal in India:
I used two data layers, one for the map of West Bengal, and the other for the inset map.
You may download a zip file containing the map of West Bengal in JPEG, PDF, and ArcMap (.mxd) formats.
I used two data layers, one for the map of West Bengal, and the other for the inset map.
You may download a zip file containing the map of West Bengal in JPEG, PDF, and ArcMap (.mxd) formats.
Location:
West Bengal, India
Friday, February 22, 2013
#India: areas under irrigation map
After being unhappy with the maps in Brahma Chellaney’s book Water: Asia's New Battleground, I decided to create my own map of areas under irrigation in India.
For this map, I used irrigation data from the global map of irrigation areas from AQUASTAT, the FAO's global information system on water and agriculture. Data shows the percentage of irrigated land per 5 arcmin cell, which is approximately 8547 hectares: someone check my calculations!
Global Map of Irrigated Ares. The Ganges River basin is the most irrigated area in the world.
You may download the map of irrigated areas in India in JPEG format or the map of irrigated areas of India in PDF format. Alternatively, if you would like to muck around with the map itself, download the ArcMap document showing irrigated areas of India.
Location:
India
Thursday, February 21, 2013
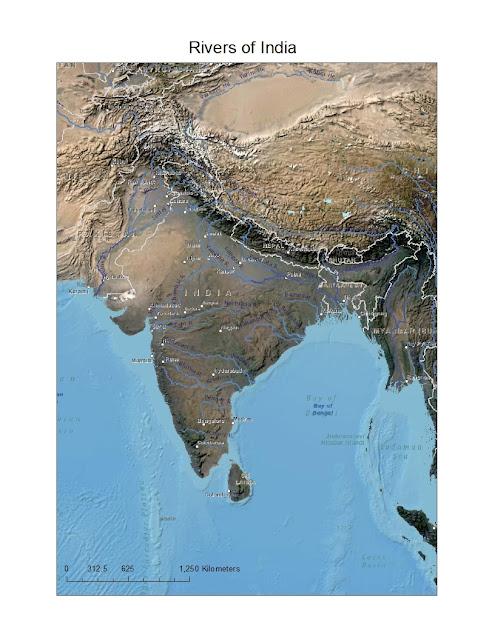
Rivers of India with Landsat imagery
Here is another map I created of the rivers of India, this time with Landsat imagery:
You may download the map of the rivers of India in JPEG format or the map of the rivers of India in PDF format. Alternatively, if you would like to play around with the map itself, download the ArcMap document showing the rivers of India.
Location:
India
Subscribe to:
Posts (Atom)


